The Pax Group
Real Traders. Real Strategy.
The History of The Opening Range
Our Opening Range trade methodology was developed over 50 years ago by commodity traders in the pits of the CME & CBOT. The Opening Range is still used every day by the CME Group, signed off by the Pit Committee and called out by the compliance officer.
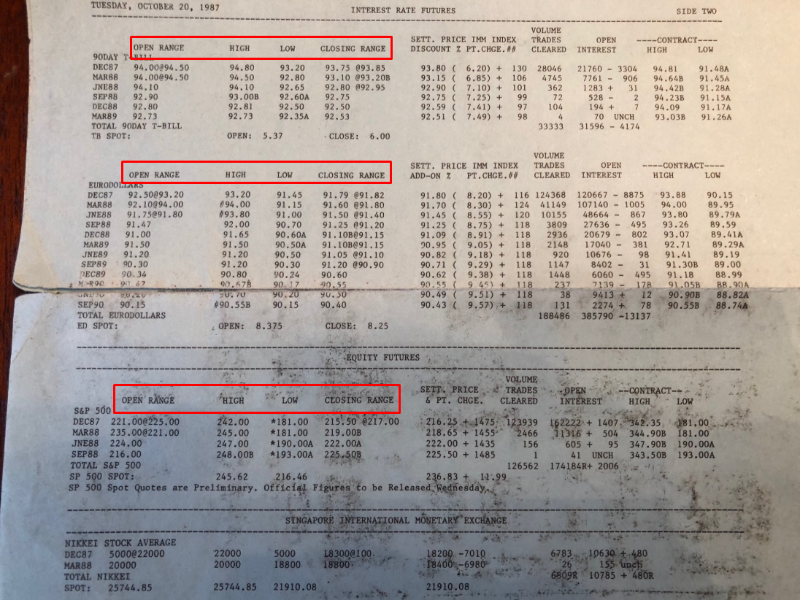
As shown on a CME price sheet from “Black Monday” on the 20th of October 1987, when the S&P 500 was trading at $200, you can see the Opening Ranges are listed and defined.
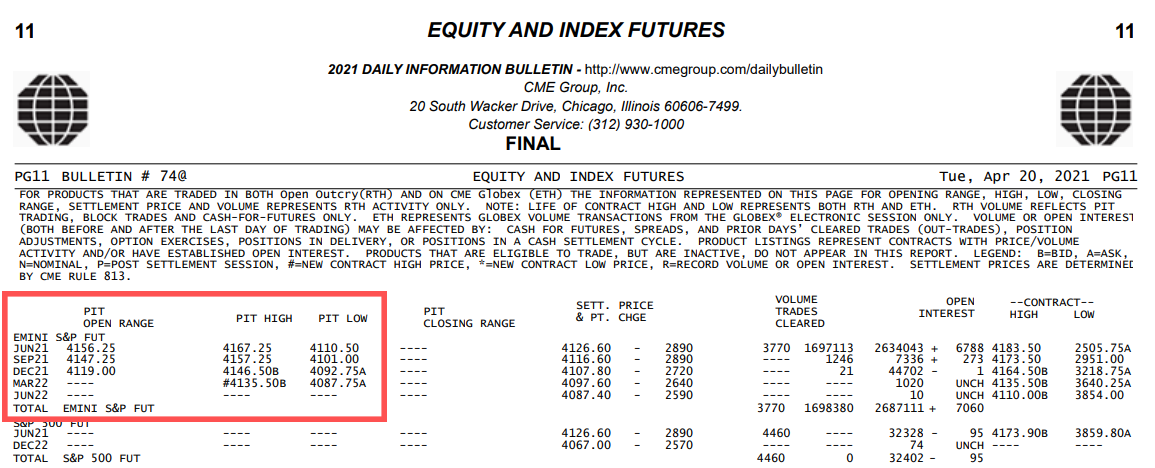
And again in 2021, the CME is still outlining the opening range in their daily bulletins. Shown in the image below.

The Opening Range on the 20th of October 1987

The Opening Range is not a made up, best fit, easy to sell marketing indicator. This is a Real Strategy and we are Real Traders.
Pax himself was on the pit committee for the NASDAQ from 2000-08 where he would sign off on the opening and closing ranges before they would become official. Pax was also on the arbitration panel from 2001-05 and on the membership committee from 1999-2002.
What is the Opening Range?
The opening range (OR) as defined by the CME is “The price range recorded during the period designated by the exchange as the official opening.”
Let’s break it down and make it easier to understand.
There are 2 functions that are considered for a product’s opening range.
- The Opening Time
- The Range Time Period
The high and low of the price traded during the range time, sets the Opening Range for the day.
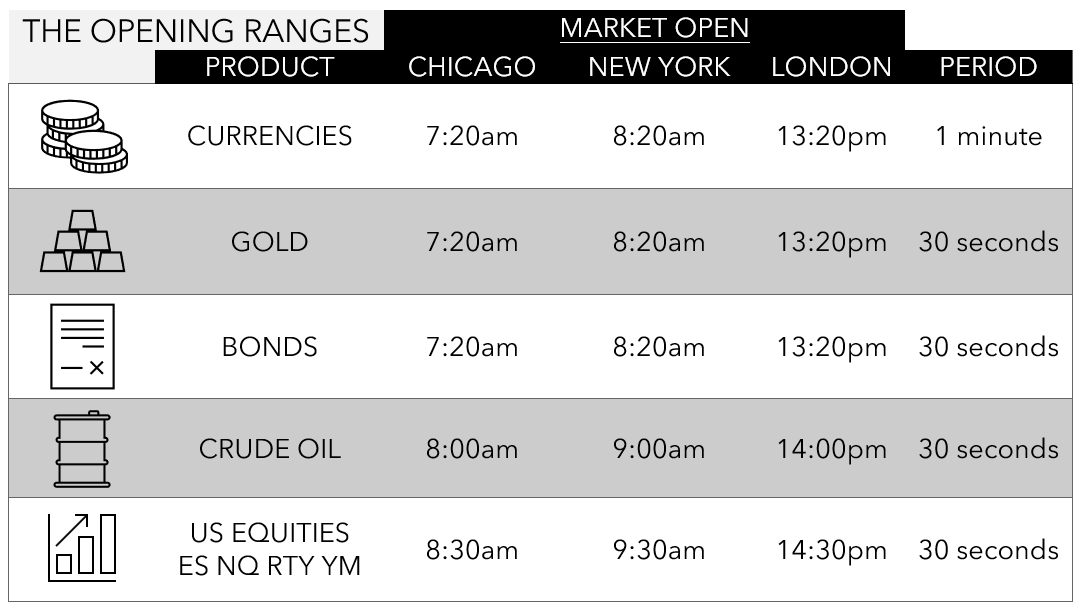
The Opening Ranges
Each Product group has their own settings. The table below outlines them.

Please be aware of day light savings
Here’s an Opening Range Example for the S&P 500 (ES)
The high and low price traded between 8:30 and 8:30:30 C.S.T. sets the opening range for the day.
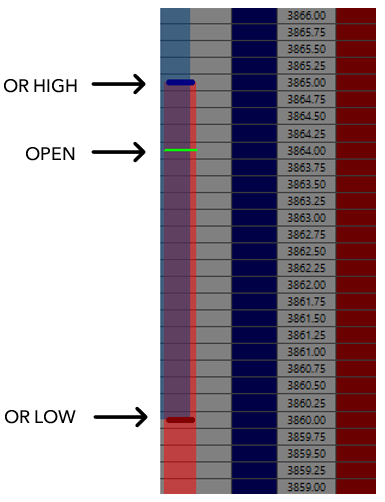
Visually, the Opening Range on the Depth of Market (DOM) is structured like this:

In the Pax Group, the Opening Ranges are automatically posted in our trading room in real time and for this example this is how the Opening Range prints in the room and displays on the DOM.

The Opening Ranges for:
ES – NQ – RTY – YM – Gold – 30 Year Bonds – Crude Oil
Are all automatically posted within the trading room, simultaneously in real time.
Opening Range Indicators
Within our group we have a list of Opening Range Indicators for a large range of different trading platforms, both for the charts and the DOMs – free for our members
Trading the Opening Range Breakout
When the market opens, the algorithms are turned on and there is a large increase in traded volume. This is the algo’s establishing their positions within the first 30 seconds of Regular Trading Hours (RTH), for equities this is 8:30am CST, hence creating the opening range. This is why we want to enter our positions at the opening range – If we get stopped out the algo’s have to stop themselves out.
Knowing this, we put our biases and opinions to the side and let price action dictate our trades. Using the Opening Range as our trade location, we are looking to get Long above the Opening Range High and Short below Opening Range Low. While price is inside the OR we do not want a position on. We trade the breakout of the Opening Range with momentum, trading only from the DOMs (not charts).
Execution is everything. There are many fake breakouts each and every trading day. At the Pax group we teach trade execution, while observing price action, matchups and momentum across multiple markets to help preserve capital and maximize profit.
Once you learn what defines a trade, you must then learn to define and control yourself. This is where most traders fail. Your ego, a lack of confidence or too much confidence, a fear of losing money and your overall relationship with money all effect your emotional state. This is why so many traders struggle to attain and maintain profitability. If this is not properly managed it can lead to costing you money if not your whole account. Pax has been through it all, so you don’t have too.
Take control of your trading and learn to execute with PAX.
GLOSSARY
Algos – Board – Breakeven Stop – Market On Close – MOC – Match – Mid-Week Shuffle – Outside Reversal Higher – ORH – Outside Reversal Lower – ORL – Pay for the trade – Price Action – Risk On/Off – Runner(s) – Scratch Stop – SPU/BOND – Time Frame Trading – Trade Location
Algos
Computer driven high frequency trading machines. Synthetic trading machines that utilize highly advanced algorithms ( synthetic Intelligence). These Boxes rely on humans for programming and turning the power switch on and off.
Board
This refers to the “Quote Board” which is comprised of all the MAJOR World Bond, Currency, Stocks, Stock Indices and Commodity Markets.
Breakeven Stop
A breakeven stop is a tool we employ to protect our days beginning balance. After we get our 4 points to “pay for the trade” we can use the 4 points as our risk capital. So we adjust our stop to use that profit as a capital preservation tool.
Market On Close – MOC
Buy or Sell an instrument @ market during the closing range.
Match
Matches are about recognizing capital flow. We want to know which of the Indices are leading and which are lagging. Furthermore and importantly, we are looking for match ups in the different Indices at Pax’s targets. These are significant matches. When targets match in Indices and related markets such as bonds, metals and currencies then we have a major target or level from which to make bigger trading decisions.
Mid-Week Shuffle
The Mid-Week shuffle (often times involves “Rip Your Face Off” contra-trend direction) is a time when markets are trying to affirm or change direction. This involves instruments that are trying to relieve the directional pressure (RSI’s) – general price action that tries to drive out directional players.
Outside Reversal Higher – ORH (Not to be confused with the Opening Range High)
Outside Reversal Higher. When a market’s price range for a particular period is outside the prior period’s range, it is an outside range. A new low from the prior period or bar followed by a new high and a close over the previous bars high – this is an ORH. These are significant as they often occur at the end of a primary downtrend. Multiple time frames can be considered and their significance weighted with other technical factors. They can telegraph big trend changes.
Outside Reversal Lower – ORL (Not to be confused with the Opening Range Low)
Outside Reversal Lower. When a market’s price range for a particular period is outside the prior period’s range, it is an outside range. A new high from the prior period or bar followed by a new low and a close below the previous bars low – this is an ORL. These are significant as they as they often occur at the end of a primary uptrend. Multiple time frames can be considered and their significance weighted with other technical factors. They can telegraph big trend changes.
Why are these important? The (OR) Outside Reversal levels are typically where shorter-term players have “Trailing” or “Resting” stops for profit protection. We identify and track these areas to determine if a trend is abating or it’s just a level that is washing out shorter-time frame investors. This is where the rubber meets the road and direction is decided.
Pay for the trade
A first target that enables us to protect our initial balance or be used as risk capital.
Price Action
As technicians we want to see how a particular instrument reacts at a specific price or level.
Is the instrument holding or failing at a specific price or predetermined level? Does the instrument reject or follow through in direction?
Risk On/Off
Risk On is generally a concerted buying of stocks and high yielding assets generated by easy money looking for a return.
Risk Off is a deleveraging of those trades. Investors sell ( liquidate holdings ) across all asset classes and buy Bonds for safety.
Runner(s)
Positions that follow the capital flow over multiple days, weeks and even months.
Scratch Stop
A scratch stop is a stop loss order placed at the exact price we initiated the trade. We are not anchored to price. We employ this stop once the market gives us more than a point or 2 of potential profit but does not pay us our 4 points. If price comes back to OR and stops us out for scratch and moves back out we can always the trade back on. We also will employ a scratch stop after we have paid for our trade to protect the entire 4 points as profit.
SPU/BOND
Long S&P 500 Futures / Short 30 Year.Bond Futures. This is an indicator of Capital Flow – “Is money is moving into equities and out of Bonds?”
Time Frame Trading
While some short term traders consider a time frame in the minutes or minute, we have a much broader view. We refer to when different regional players come into the market. This can be Europe ’s opening and Asia ’s close or the U.S. opening of Futures through London ’s close and NYC ’s lunch time. The bigger time frames always start and stop at the end or beginning of a major Financial center ’s trading hours. This is when we look for order flow to ebb, and possibly change direction.
Trade Location
The level or area to best manage your risk. This comes down to Intelligent Risk Management. Where can an investor initiate a trade with a defined risk parameter (STOP).
Where can you initiate a trade and have a reasonable chance of success?
In other words… know where you’re wrong. This has two key elements… Timing and Technical level. Both need to be correct.
This is the where and when, very crucial for low risk investing and trading.
